

Data without context convinces no one. A report full of numbers can be one hundred percent correct and still lose its audience in the first two minutes. The difference between a presentation that gets forgotten and one that drives decisions comes down, largely, to how the information is visualized.
The presentation tools ecosystem has changed fast. Today, visual analytics platforms, AI generators, and general-purpose presentation software all coexist. Choosing well depends on the type of data, the time available, and the audience the presentation is aimed at.
The Seven Tools
1. Tableau
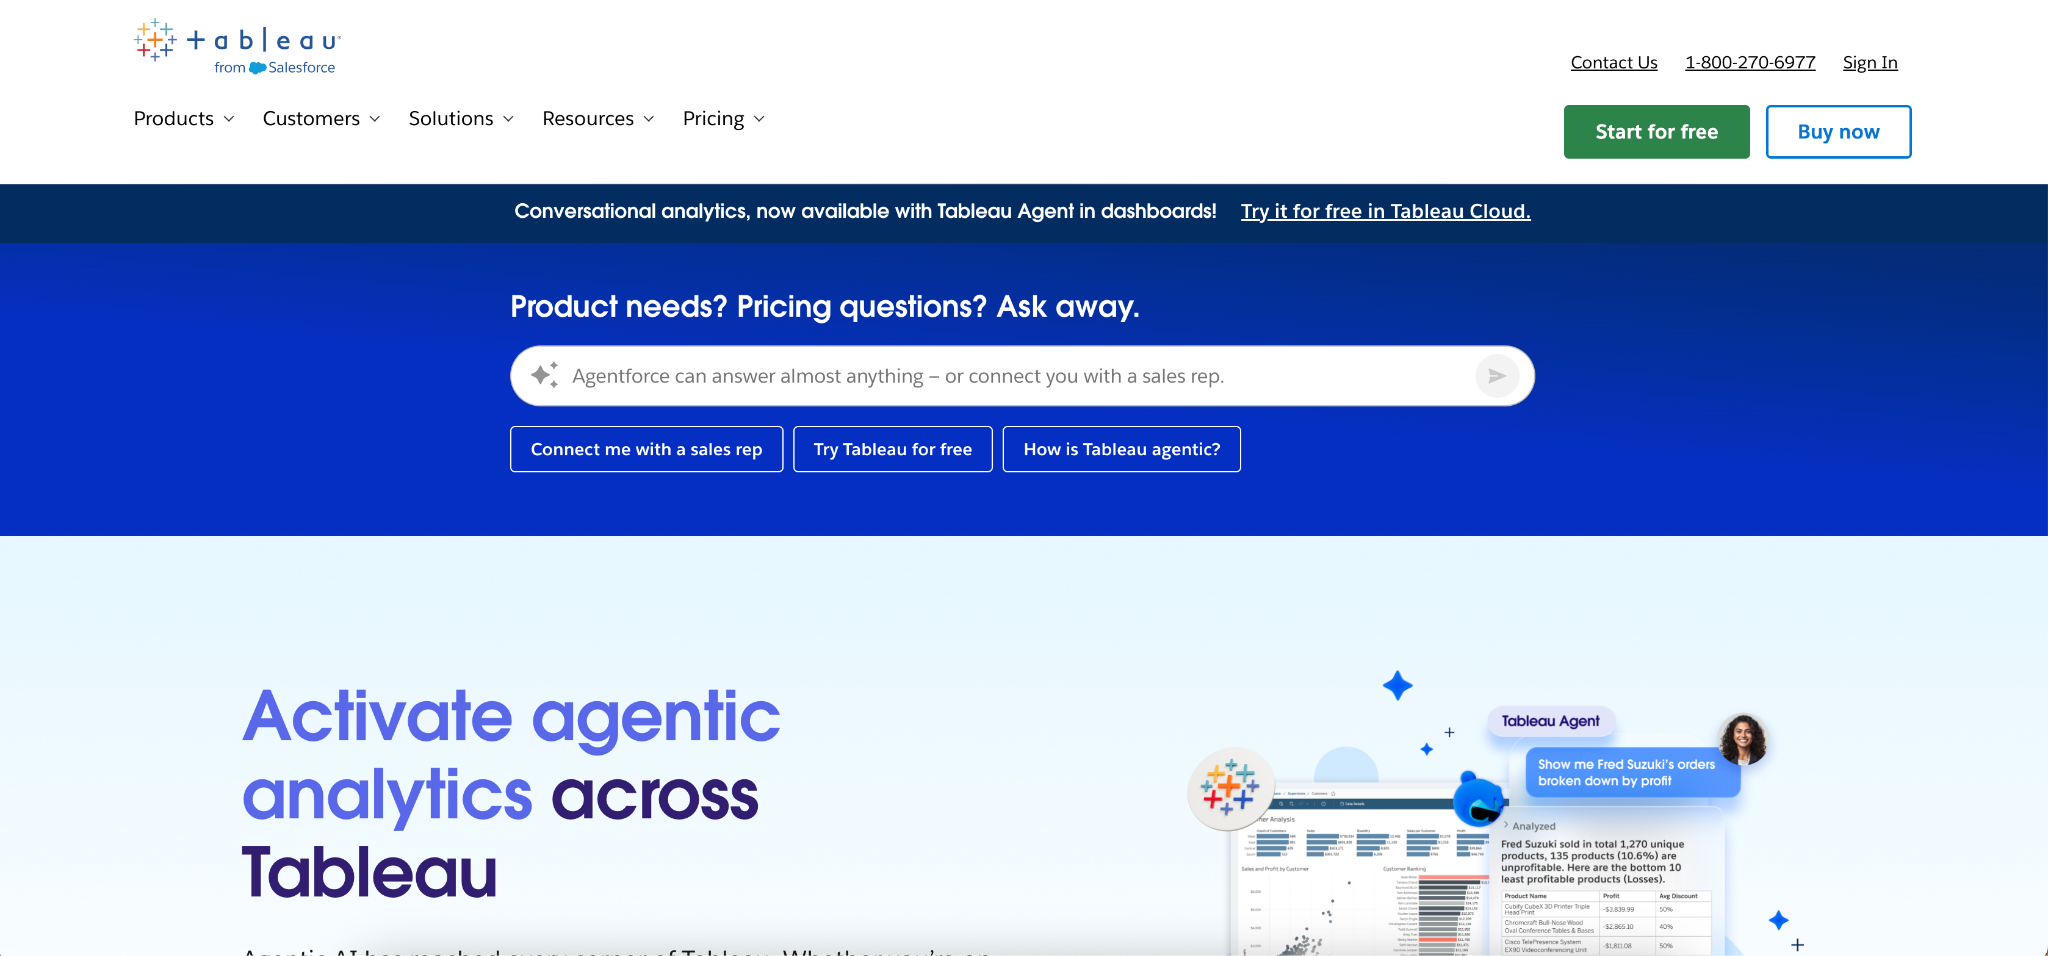
The reference standard in analytical data visualization. Tableau connects to databases, spreadsheets, and cloud sources, and builds interactive dashboards with real-time filters and charts. It is not a conventional presentation creator, but its views can be exported as slides or embedded in online presentations via link.
What separates it from the rest is the analytical depth. For data with multiple variables that change constantly, nothing else on this list comes close. Tableau Public is free for public data; Tableau Creator starts at $70 per user per month.
2. Slideonic

Converting an existing report into a presentation usually takes longer than expected. Slideonic starts from what you already have: a text, a PDF, a DOCX, or simply a written topic. The AI first generates a structured outline that you can review and reorder before producing the full deck. That step makes a real difference compared to other presentation platforms that deliver the result without any chance to intervene.
The result is a deck ready to edit or download without having touched a single template manually. For those who work with reports or analyses and need fast professional presentations without spending hours on design, using Slideonic fits directly into that workflow. The free plan allows one daily presentation with no watermark and no feature restrictions. Paid plans start at $2 for a 7-day trial with full access, $14.99 per month on the monthly plan, or $9.99 per month on the annual plan, roughly 65% cheaper than monthly.
3. Microsoft Power BI
Microsoft’s alternative to Tableau, with tight integration with Excel, Teams, and the rest of the Microsoft 365 ecosystem. Its reports embed directly into PowerPoint, which simplifies the workflow for organizations already operating in that environment. The learning curve is lower than Tableau, and so is the price: Power BI Desktop is free, Power BI Pro costs $10 per user per month.
Worth it if your team already lives in Microsoft. It does not make much sense to adopt it otherwise.
4. Canva

The most popular presentation app among users without a design background. Editable templates, real-time collaboration, a library of visual assets. Magic Design generates an online presentation from a prompt, though the result needs more manual editing than specialized AI generation tools. Free plan available; Pro from $14.99 per month.
What distinguishes Canva is not the AI generation but the editing flexibility afterwards. It is a destination, not a starting point.
5. Visme

Visme combines presentation design with data visualization. It lets you create animated charts, infographics, and interactive presentations with connectors to external data sources. It has more data-specific tools than Canva, which makes it more useful for proposals and visual reports with quantitative content. Free plan with watermark; Starter from $12.25 per month on annual billing.
6. Google Slides con SlidesAI
Google Slides is the base; SlidesAI is the add-on that brings automatic generation of digital presentation types directly into Google Workspace. Paste the text, select the presentation type, and the AI formats the slides. The result is functional for internal use, visually more basic than the other options. Three presentations per month on the free plan; Pro from $10 per month.
The main advantage is that you never have to leave Google Workspace. For teams already working there, the friction is minimal.
7. Prezi
Prezi does not work with linear slides. Its spatial canvas with zoom allows navigation between topics in any order, which works well for dynamic live presentations in front of an in-person audience. It is not the option for exporting complex data or intensive collaborative work, but in a room full of standard PowerPoints, a Prezi presentation gets remembered. Free plan with Prezi branding; Standard from $7 per month.
Which to Use and When
| Situation | Recommended Tool |
| I have a document and need to convert it into slides | Slideonic |
| Complex data that changes constantly | Tableau or Power BI |
| Flexible design, time to edit | Canva or Visme |
| My team uses Google Workspace | SlidesAI |
| Live presentation, want to stand out visually | Prezi |
| Microsoft ecosystem, most direct route | Power BI with PowerPoint |
In practice, many teams make products special by combining more than one tool. Tableau or Power BI for analysis, Slideonic or Canva for the final professional presentation. The strategic work lies in interpreting the data; the visual part can largely be automated.
FAQ
What is the best free presentation software? Google Slides for general use. For automatic AI generation without a watermark, Slideonic allows one full daily presentation on its free plan.
Does Tableau work for presentations? It is a data analysis and visualization tool. Its views can be exported or embedded in presentations, but it does not replace a presentation program like PowerPoint or Google Slides.
Do AI tools replace PowerPoint? They reduce the time spent in PowerPoint, they do not eliminate it. Most export in PPTX format, which allows continued editing in the usual environment.
What is the difference between an interactive presentation and a traditional one? An interactive presentation lets you filter data, click, or navigate in a non-linear order. Tableau and Prezi allow that level of interaction; static formats like PowerPoint do not.
How much does it cost to create professional presentations with AI? Slideonic starts at $2 for a full 7-day trial. Canva Pro and SlidesAI cost between $10 and $15 per month. Tableau is the most expensive option for professional use, from $70 per month.