Easy Ways to Automate Your Trend Analysis
Do you spend hours analyzing trends and patterns in your business data? There are easy ways to automate this process and save time. By using the right tools and techniques, you can streamline your trend analysis and make more informed decisions for your business.
We’ll explore some simple yet effective methods for automating your trend analysis in this article, allowing you to focus on other important aspects of your business.
Setting Up Your Trend Analysis Automation
How Do Automatic Trend Lines Work?
Automatic trend lines are a helpful tool in trend analysis. These lines are drawn with precision using a special algorithm. The platform considers reaction highs and lows to place these lines automatically on the chart.
Once drawn, the lines stay visible unless the price moves too far away. They can also be used with Multi-Time Factor Analysis (MTFA) for different time compressions.
Traders have a lot of flexibility with these lines. They can create alerts, lock the trend line, remove it, or remove all related lines with just a right-click.
Additionally, traders have control over preference settings and can filter out unnecessary trend lines. Advanced customization settings are available to influence how these lines are generated and displayed. This includes variables like candle highs, time frames, ATR length, and ATR factor.
Creating Trend Lines with a Simple Click
Traders can easily create trend lines in TrendSpider. Simply click on the Trends button from the top toolbar to add automated trendlines to the chart. The platform draws trend lines from reaction highs and lows. With Multi-Time Factor Analysis turned on, traders can use auto trend lines to plot automatic trendlines on different time compressions. After creating the trend lines, traders can right-click on them to set alerts, lock, or remove them.
They can also manage preference settings and filter the automatically generated trend lines on the chart.
Additionally, traders can customize how automated trendlines are generated and appear on the chart, allowing them to influence the number of trendlines plotted based on the distance between candle highs and price gaps.

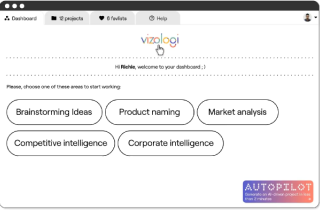
Vizologi is a revolutionary AI-generated business strategy tool that offers its users access to advanced features to create and refine start-up ideas quickly.
It generates limitless business ideas, gains insights on markets and competitors, and automates business plan creation.


