Real Talk: A Business Analysis Example Explained
Are you a business student or professional? Do you want to understand business analysis? You’re in the right place!
In this article, we’ll break down a real-life example of business analysis. You’ll gain a practical understanding of how this business process works. We’ll dissect a specific case study to provide valuable insights into methods and strategies used to analyze and improve business operations. So, grab a notebook and get ready to dive into business analysis with a hands-on example!
Defining Business Analysis: A Practical Overview
Business analysis involves identifying and categorizing solutions to maximize value for stakeholders. This includes setting strategy, developing enterprise architecture, and specifying project objectives.
It helps realize benefits, avoid costs, spot new opportunities, understand necessary competencies, and model the organization’s improvement.
Business analysis can be used for strategic growth using important models like activity diagrams, mind mapping, product roadmaps, organizational charts, user interface wireframes, and SWOT analysis. These models are essential for visualizing and analyzing data, enhancing process effectiveness, and understanding project strategies.
The Critical Role of Business Analysis
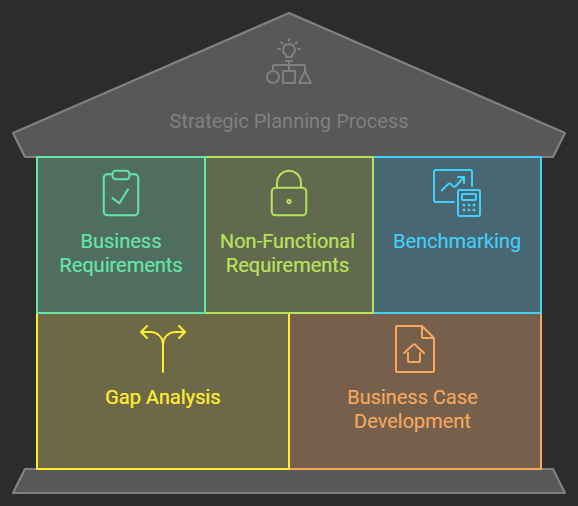
Business analysis reports have several important components:
- Business requirements
- Non-functional requirements
- Benchmarking
- Gap analysis
- Business case development
- Risk assessment
- Problem-solving
- Market analysis
- Competitive analysis
These components help understand the organization’s needs, identify risks and areas for improvement, and monitor market trends.
Business analysis helps in strategic growth by:
- Identifying necessary competencies
- Realizing benefits
- Understanding new opportunities
Real-world scenarios provide insights into market trends, customer behavior, competitive strategies, and potential risks.
Vital business analysis models include:
- Activity diagrams
- Mind mapping
- Product roadmaps
- Organizational charts
- User interface wireframes
- SWOT analysis
Using these models helps identify opportunities, understand risks, enhance process effectiveness, and drive business growth.
Key Components of a Business Analysis Report
Components to Include
A business analysis report should include the following:
- Business requirements
- Non-functional requirements
- Benchmarking
- Gap analysis
- Business case development
- Risk assessment
- Problem-solving
- Market analysis
- Competitive analysis
These components help identify areas for improvement and growth. The report’s structure contributes to its effectiveness by presenting data and findings clearly and logically. Models like activity diagrams, mind mapping, product roadmaps, organizational charts, user interface wireframes, and SWOT analysis aid in complex data visualization and analysis. Crafting an exceptional report involves including key elements like data analysis, stakeholder analysis, and real-life examples. It also involves solving business problems, improving processes, supporting decision-making, and providing insights into the importance and application of each key aspect.
The Structure of an Effective Analysis Report
An effective analysis report should include several key components. These are:
- Business requirements
- Non-functional requirements
- Benchmarking
- Gap analysis
- Business case development
- Risk assessment
- Market analysis
These elements provide comprehensive insights into the organization’s needs, opportunities, and challenges.
The structure of an effective analysis report should have the following:
- A clear introduction
- Main analysis sections
- A summary of findings and recommendations
This organization ensures clarity and coherence in presenting the analysis process, results, and action plans.
To craft an exceptional business analysis report, presentation techniques such as:
- Activity diagrams
- Mind mapping
- Product roadmaps
- User interface wireframes
These visual aids enhance the understanding of complex information and facilitate effective communication of the analysis findings to stakeholders and decision-makers.
Examples of Business Analysis In Action
Analyzing Examples for Better Understanding
Studying real-world business scenarios helps people understand the essential components of a business analysis report. By looking at examples of business analysis, individuals can learn how to identify problems, improve processes, support decision-making, and achieve project success. This knowledge can be used to enhance their analysis skills through Business Analysis Training courses.
Real-world examples also show the importance of analysis models like SWOT and PESTLE, which can be used for strategic growth, visualizing and analyzing data, improving processes, and understanding project strategies.
Real-world Business Analysis Scenarios
Business analysis helps find ways to grow and improve a business. It looks at market trends, customer needs, and competition.
For example, analysts might study new markets or ways to stand out from competitors. But it’s not always easy. They might deal with bad data, resistance to change, or conflicts among people involved. To make a difference, it’s essential to present findings well. Using charts and graphs, tailoring the presentation to the audience, and making useful recommendations are key. Collaboration and getting input from others also play a big part in making smart decisions based on the analysis.
Vital Business Analysis Models
Activity Diagrams

Activity diagrams are a useful tool for modeling business processes. They use symbols and notations to show a system’s sequence of activities, decision points, and control flow.
Activity diagrams map out the steps and transitions in a process, providing a clear and easy-to-understand workflow representation. This helps stakeholders understand the process comprehensively.
The main elements and symbols used in activity diagrams include actions (rounded rectangles), decisions (diamonds), and flow of control (arrows). These symbols illustrate the sequence of activities and decisions, making it easier for analysts and stakeholders to comprehend the process flow and identify areas for improvement.
Activity diagrams also help to spot bottlenecks or inefficiencies in a process by visually representing the sequence of activities and decisions. This lets analysts identify where there may be interruptions in control flow or actions that cause delays or resource constraints. Analyzing the activity diagram makes optimizing the process and improving workflow efficiency easier.
SWOT Analysis

A SWOT analysis is a helpful tool for businesses. It identifies internal strengths and weaknesses, as well as external opportunities and threats.
By recognizing strengths like a strong brand or efficient processes, businesses can gain a competitive edge and seize opportunities for growth, such as emerging market trends.
Additionally, it helps to identify external threats, such as new competitors or changing regulations, that could negatively affect the business.
PESTLE Analysis

Political factors, like government stability, tax policies, trade restrictions, and labor laws, can impact a business. Changes in trade agreements can affect costs and market access, while shifts in labor laws can affect workforce management. Economic factors, such as inflation rates, exchange rates, and economic growth, can influence consumer spending habits and purchasing power, affecting financial performance. For instance, a recession can lead to reduced consumer spending.
Social and cultural trends, including demographic shifts, lifestyle changes, and consumer behavior, are important for businesses evaluating marketing strategies. An aging population may increase demand for healthcare products while shifting consumer preferences towards sustainability, impacting product development.
Anatomy of an Exceptional Business Analysis Report
Crafting the Report

A business analysis report has several important components. These include business requirements, non-functional requirements, benchmarking, gap analysis, and project objectives.
These components help in understanding the business environment and finding areas for improvement.
The report’s structure is also important. Models like activity diagrams, mind mapping, product roadmaps, and SWOT analysis can enhance its effectiveness.
Visual aids help analyze data, improve processes, and understand project strategies.
Lastly, presentation techniques like data analysis, stakeholder analysis, and competitive analysis are valuable for crafting a top-notch business analysis report.
These techniques help solve business problems, aid decision-making, and present information clearly and impactfully to ensure project success.
Presentation Techniques

Effective presentation techniques for business analysis reports include using visual aids like graphs, charts, and diagrams to show data and trends. Also, structuring the report with clear headings, subheadings, and bullet points helps organize the information. Using a storytelling approach to present the findings and insights of the report can make the content more engaging and relatable to the audience.
These techniques boost the impact and understanding of business analysis reports by providing a clear and visually appealing way to convey complex information. Visual aids simplify data and make it easier to understand, while a well-structured and logically presented report ensures the audience can follow the content easily. Engaging storytelling techniques can capture the audience’s attention and make the information memorable.
These techniques are important in effectively conveying the findings and insights of a business analysis report by ensuring the content is presented in a compelling and accessible manner. Well-designed visual aids and a structured approach help communicate the key points clearly. At the same time, storytelling techniques can create an emotional connection with the audience, making the findings and insights more impactful and memorable.
Leveraging Business Analysis for Strategic Growth
Agency and Small Business Report Insights
Business analysis reports are valuable for agencies and small businesses. They help make strategic growth decisions by identifying competencies, understanding opportunities, and modeling improvement. This can lead to benefits, cost avoidance, and maximizing value for stakeholders.
An effective analysis report includes business requirements, non-functional requirements, benchmarking, gap analysis, business case development, risk assessment, problem-solving, market analysis, and competitive analysis. These components comprehensively understand the organization’s needs, challenges, and potential growth opportunities.
Models like SWOT and PESTLE analysis can provide valuable insights for agency and small business reports. They help visualize and analyze data, enhance process effectiveness, and understand project strategies. These models are important for identifying strengths, weaknesses, opportunities, threats, and factors impacting business operations and growth.
KPI Reporting Strategies
When developing a KPI reporting strategy, it is important to choose KPIs that match the organization’s goals. These KPIs should be relevant, measurable, and linked to the business’s overall success.
For instance, sales departments may focus on KPIs like revenue growth, customer acquisition cost, and conversion rates. In contrast, marketing departments might look at metrics such as website traffic, leads generated, and return on investment.
Customizing KPI reporting strategies for different departments involves understanding their unique needs and priorities and selecting KPIs that directly contribute to their success.
When presenting KPI data, it’s best to use visualizations like charts and graphs. These help stakeholders easily understand and act on the information. For example, a sales dashboard may use line graphs to show revenue trends, while a marketing report could include pie charts to illustrate leads by source.
It’s also helpful to provide context and explanations alongside the data. This can help stakeholders grasp the significance of the KPIs and how they impact the organization’s overall performance.
Benchmarking Your Business Using Analytical Reports
Analytical reports for benchmarking a business should include key performance indicators. These include financial metrics like revenue, profit margins, expenses, customer satisfaction scores, employee productivity measures, market share data, and operational efficiency statistics. These indicators give a comprehensive overview of the business’s performance and areas for improvement.
Analytical reports help identify areas for improvement and set benchmarks for business growth. They do this by analyzing historical data, current trends, and industry standards. Comparing the business’s performance against these factors can pinpoint areas for improvement and opportunities for growth and expansion.
Effective techniques for comparing business performance against industry standards using analytical reports include trend analysis, ratio analysis, variance analysis, and benchmarking against competitors. These techniques help businesses gain insights into their relative performance and make informed decisions about strategic initiatives and operational improvements.
Vizologi is a revolutionary AI-generated business strategy tool that offers its users access to advanced features to create and refine start-up ideas quickly.
It generates limitless business ideas, gains insights on markets and competitors, and automates business plan creation.

Vizologi
A generative AI business strategy tool to create business plans in 1 minute
FREE 7 days trial ‐ Get started in seconds
Try it freeCreate business plans in 1 minute
Generate limitless business ideas, gain insights on markets and competitors, and automate business plan creation