Infrastructure monitoring tools all promise the same thing: visibility and reliability in production. The challenge is that exploding telemetry data from cloud-native applications has turned infrastructure monitoring into a massive data challenge. So choosing the right monitoring infrastructure tools isn’t about UI features; it’s an architectural decision. This piece gets into six leading options for 2026 and helps teams select an infrastructure monitoring tool that delivers real value without overwhelming costs or complexity.
- Netdata
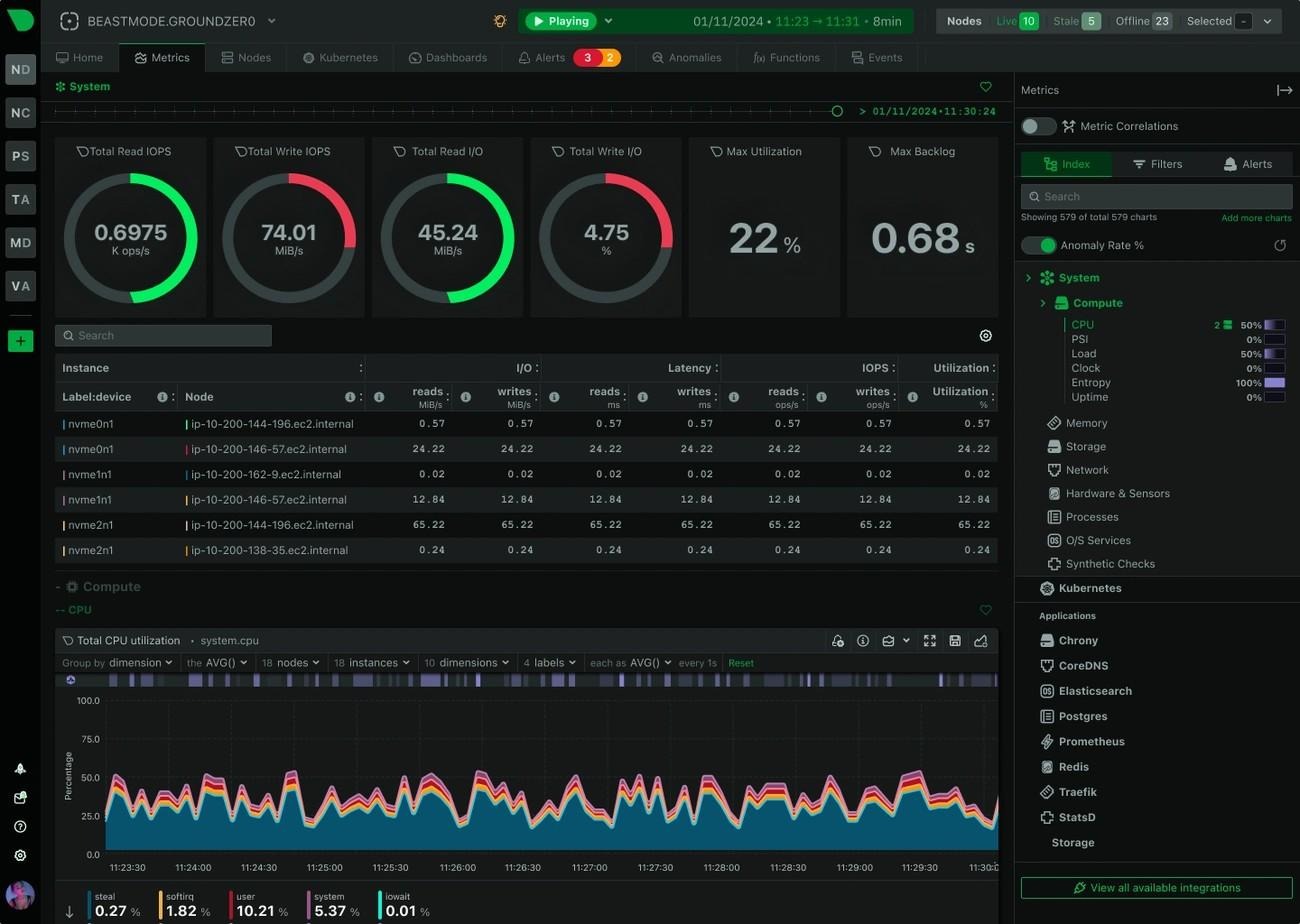
Netdata delivers real-time infrastructure monitoring through an autonomous agent designed to collect metrics, logs, and performance data across entire environments without manual configuration. The platform provides per-second data collection and automated dashboards, which allow teams to identify performance issues immediately and troubleshoot systems with minimal delay. Its lightweight architecture uses approximately 5% CPU and minimal memory, which makes it suitable for production environments without adding significant overhead.
The Netdata agent automatically discovers infrastructure components and integrates with more than 800 services, including cloud platforms, containers, databases, and operating systems. This auto-discovery capability eliminates complex setup requirements and ensures monitoring coverage across hybrid and multi-cloud environments. The platform aggregates metrics from multiple agents into centralized parent nodes, which enables unified visibility and scalable monitoring across distributed infrastructure. Organizations can deploy Netdata on-premises or use its fully managed cloud platform, which provides global access, automatic updates, and high availability.
Netdata includes built-in machine learning and AI-powered troubleshooting features that detect anomalies, correlate system behavior, and identify root causes automatically. The platform delivers instant alerts, customizable dashboards, and guided troubleshooting workflows that help teams resolve incidents faster. Its distributed architecture eliminates complex data pipelines and allows metrics to remain on local infrastructure while still enabling centralized visibility. Real-time dashboards update instantly and support advanced filtering, visualization, and performance analysis across hosts, containers, and applications.
With automated monitoring, unlimited metric collection, and extensive integrations, Netdata provides complete infrastructure visibility while reducing operational complexity. Its real-time observability and autonomous monitoring capabilities help organizations identify performance issues quickly and maintain consistent system reliability. These strengths position Netdata as a best infrastructure monitoring tool for teams that need instant insights without heavy resource requirements or complex configuration. Its efficient architecture and flexible deployment options make it well suited for modern distributed environments that demand speed, scalability, and continuous visibility.
- Datadog
Datadog positions itself as a unified observability platform that unites infrastructure, application, log, and user-experience monitoring into a single interface. The platform aggregates data across technology stacks, supporting more than 500 integrations. Teams can troubleshoot, alert, and visualize system behavior from one location. Organizations seeking to reduce tool sprawl and eliminate context switching between monitoring systems find this consolidation approach appealing.
An open-source agent deploys the platform and collects metrics from hosts and containers at 15-second intervals. This agent-based architecture is different from agentless monitoring solutions. Installation on each monitored resource is required. Datadog supports deployment in on-premise, hybrid and cloud environments, with native integrations for AWS, Azure, Google Cloud, Kubernetes and over 400 other technologies. The Azure Native Integration enables teams to provision, manage and bill Datadog services directly through the Azure portal. Unified billing gets reported through Azure monthly statements.
Tag-based search and analytics form the core of Datadog’s querying capabilities. Teams can slice metrics by specific infrastructure subsets. The platform has machine learning-based anomaly detection tools that flag atypical system behavior without manual threshold configuration. Datadog’s unified platform extends beyond infrastructure to application performance monitoring, log management and digital experience monitoring. The tool positions itself as a full-stack observability solution.
- New Relic
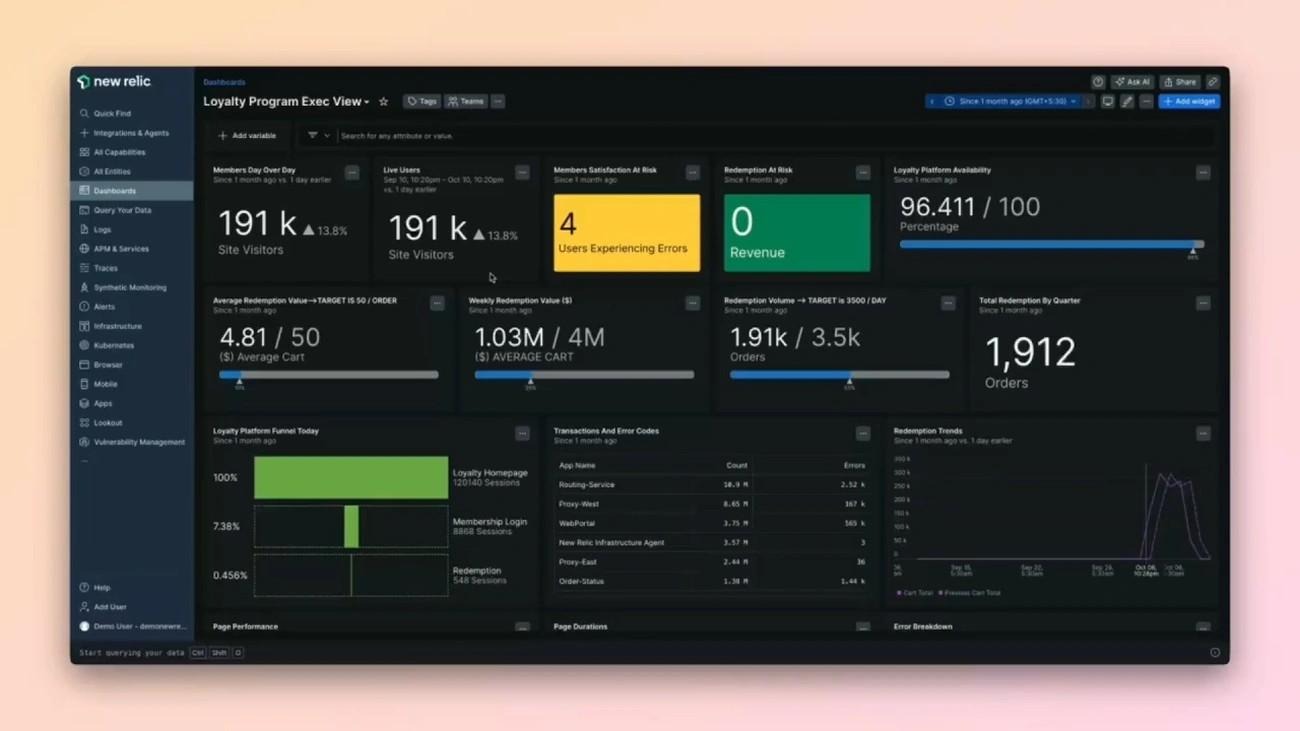
New Relic collects and displays infrastructure data every five seconds, which gives teams near-immediate visibility into their entire environment. This rapid data collection helps detect performance anomalies and configuration changes quickly. The platform combines infrastructure monitoring with application performance data and creates a correlation between host metrics and application behavior for full-stack troubleshooting.
The infrastructure agent operates as a lightweight data collector that imports metadata and tags from cloud instances automatically. Organizations can monitor hosts on AWS EC2, Azure VMs, and Google Compute Engine with functionality similar to traditional data center hosts. New Relic provides pre-configured dashboards for each cloud service along with dynamic alerting, fast deployment, and integrations with more than 100 services. Many cloud integrations operate without installing the infrastructure agent and instead connect through account linking.
Kubernetes monitoring enables multi-dimensional cluster exploration across metrics, events, logs, and traces through a dedicated cluster explorer interface. Teams can troubleshoot both application-level and infrastructure-level components while maintaining performance and operational consistency. On-host integrations extend monitoring to databases, messaging systems, and application servers, while support for open-source telemetry frameworks like Prometheus, StatsD, and JMX allows flexible data collection. Custom integrations can also be built using SDKs or APIs.
Filter Sets group entities based on work patterns, which helps teams focus on relevant hosts and services. The Inventory feature identifies vulnerable packages and outdated software and provides complete host visibility. A live event feed captures infrastructure changes such as host updates, service modifications, and configuration adjustments to support faster root cause analysis.
New Relic displays health metrics across hosts, processes, networks, and storage systems. Teams can monitor CPU usage, track disk capacity, analyze network performance, and create targeted alerts. Centralized log forwarding, dynamic alert scaling through tags, and detailed container monitoring give teams deeper visibility and help reduce mean-time-to-resolution across modern infrastructure environments.
- Dynatrace
Dynatrace automates data collection and analysis across infrastructure environments, eliminating the manual instrumentation that burdens development teams. OneAgent detects all applications, containers, services, processes, and infrastructure automatically upon startup with zero configuration or code changes. This automated discovery distinguishes Dynatrace from many monitoring infrastructure tools that require extensive manual setup. System components receive high-fidelity observability immediately after deployment, which helps teams maintain visibility as environments scale.
The platform captures and unifies dependencies between observability data sources. It combines metrics, logs, traces, user experience information, and security data into a real-time entity topology map. Smartscape creates an auto-discovered topology that maps all components and their relationships across applications, services, processes, hosts, and data centers. Dynatrace Intelligence builds on this foundation by automating anomaly detection and root-cause analysis, even within dynamic microservice environments.
Smart baselining continuously learns normal performance patterns and adapts as environments evolve. Dynatrace anomaly detection monitors critical parameters and raises alerts when performance deviates from established baselines. This approach helps organizations reduce major outages and degradations while improving operational efficiency. Teams benefit from faster troubleshooting and improved productivity through automation.
Grail serves as Dynatrace’s data lakehouse for observability and analytics. It unifies logs, metrics, traces, and events into a topology-aware model using indexless, schema-on-read storage. Dynatrace also supports OpenTelemetry as an additional data source, which expands observability coverage. The platform scales across microservices and multi-cloud environments while OneAgent updates automatically to ensure consistent monitoring and maintainability.
- SolarWinds Observability
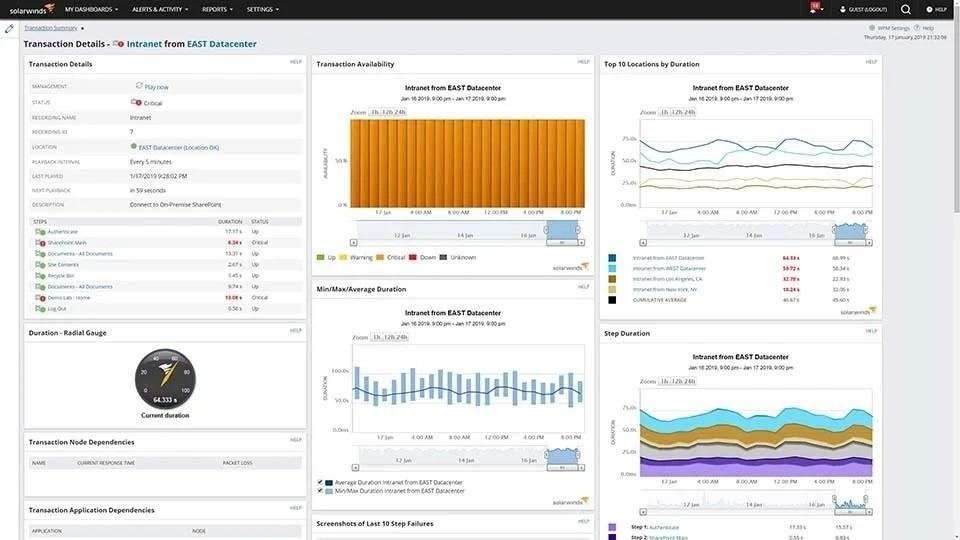
SolarWinds Observability operates through two deployment models tailored to different organizational requirements: Self-Hosted software installed behind firewalls and SaaS delivered from cloud-native infrastructure. This dual-option architecture addresses security and compliance needs for organizations that require on-premises data control while also offering cloud convenience for faster deployment and managed services. Both deployment models deliver end-to-end hybrid visibility with strong interconnectivity, which gives IT teams flexibility to monitor complex environments according to their priorities.
The SaaS platform provides unified visibility across cloud-native, on-premises, and hybrid applications through a single-pane-of-glass interface that reduces tool sprawl. Built-in intelligence accelerates issue resolution by surfacing actionable insights based on data collected across the entire environment. AIOps capabilities use machine learning to prioritize real problems and reduce alert fatigue. Continuous connectivity between SaaS and Self-Hosted deployments creates a unified monitoring view across hybrid and multi-cloud environments.
Database performance monitoring supports systems such as MySQL, PostgreSQL, MongoDB, Azure SQL, Amazon Aurora, and Redis. This visibility improves system performance and helps teams optimize infrastructure usage. Application performance monitoring combines transaction tracing, code profiling, exception tracking, and end-user experience monitoring. Synthetic and real user monitoring provide additional insight for troubleshooting application performance.
Network and infrastructure monitoring extends to network devices, servers, virtual machines, and cloud services. NetPath visualizes network paths end-to-end, while PerfStack enables deeper performance analysis. Intelligent Mapping simplifies hybrid network visibility. SolarWinds Observability also integrates with hundreds of third-party services, which allows DevOps, IT Ops, and Cloud Ops teams to monitor infrastructure, applications, databases, and user experience within a unified platform.
- Prometheus
Prometheus was developed by SoundCloud in 2012 to address metrics collection and alerting requirements that existing monitoring infrastructure tools could not meet. The platform joined the Cloud Native Computing Foundation in 2016 and achieved graduated project status in 2018. This open-source systems monitoring toolkit stores metrics as time series data and records measurements with timestamps and optional key-value pairs called labels.
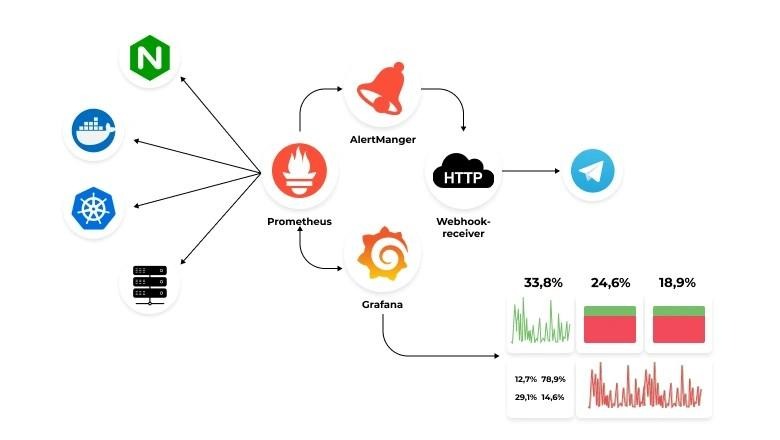
Four primary components form the platform’s architecture. The main Prometheus server scrapes and stores time series data while handling queries. An internal time series database serves as the storage backend, with options to send data to remote storage solutions like Thanos, Cortex, and VictoriaMetrics for centralized metrics and long-term retention. Exporters translate data from systems without native Prometheus support into compatible metrics formats. AlertManager handles alert notifications, deduplication, and delivery.
Prometheus retrieves metrics through a pull model over HTTP rather than requiring systems to push data. The server maintains endpoint lists through static configuration or automated service discovery and polls targets at defined intervals. A single server can handle millions of metrics per second, while distributed deployments scale to much larger environments. This pull-based approach ensures consistent data collection while reducing system overhead.
PromQL serves as the platform’s query language and enables metric selection, aggregation, and time-based analysis. Alert rules use PromQL queries and trigger notifications through email, Slack, PagerDuty, SMS, and other integrations. Prometheus integrates natively with Kubernetes and cloud-native environments, where service discovery automatically detects new instances. Released under the Apache 2 License, Prometheus remains free and widely adopted for reliable infrastructure monitoring.
Conclusion
Infrastructure monitoring has become a strategic layer that directly influences reliability, operational efficiency, and long-term scalability. Modern environments generate continuous streams of telemetry from containers, cloud services, and distributed systems, which means monitoring tools must do more than display metrics. They must help teams understand system behavior, detect anomalies early, and reduce the time required to diagnose and resolve incidents. Organizations that invest in the right monitoring platform gain stronger control over performance, avoid costly downtime, and support faster development cycles without compromising stability.
The best choice ultimately depends on your architecture, operational model, and internal expertise. Some teams benefit most from fully automated platforms that minimize configuration and accelerate troubleshooting, while others prefer flexible open-source solutions that offer deeper customization and control. As infrastructure continues to grow in scale and complexity, monitoring becomes less about collecting data and more about turning that data into clear, actionable insight. Selecting a platform that aligns with your technical goals and growth plans will help ensure consistent performance, predictable operations, and greater confidence in your production systems.