
Trading volume indicates how many traded shares of an asset transferred ownership over any given time frame. This sounds easy, until a busy market barely moves or a quiet one shoots out of the blocks. That figure is helpful when you look at the price movement it created versus the activity.
Volume up establishes that more units are traded. It doesn’t show that more people took part, that investors came to an agreement on value, or that the next move continues. The same players can repeat trades, and an execution spurt can come with either new positioning or panicked exits.
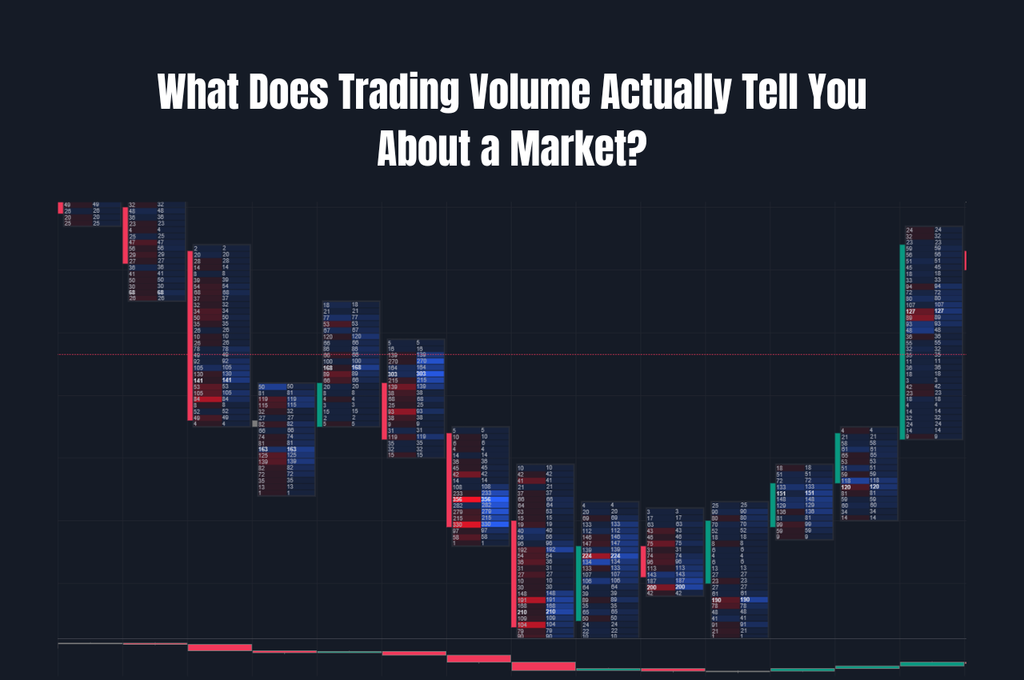
That distinction becomes easier to study when volume appears alongside price. You can try out analytical software for futures traders here, including footprint charts and volume profiles that organize executed trades by price level. These views provide evidence for independent analysis, while the trader remains responsible for interpreting it.
First, Establish What the Number Counts
For shares, volume typically measures the number of shares traded. In the case of futures, it counts contracts. Cryptocurrency platforms might measure the number of units of the asset or turnover expressed in a quote currency, such as dollars. Compare the two markets — a million contracts and a million dollars are not the same thing.
The price of the asset can be measured in turnover as well. Trading 1,000 shares at $20 produces $20,000 in turnover; the same quantity at $25 produces $25,000. The dollar value has grown by 25 percent, but the number of shares traded is the same.
If 100 future contracts are traded in one transaction, this will add 100 contracts to volume, with both sides of the transaction (buyer and seller) contributing to the total number of contracts traded. If those contracts change hands again, another 100 count toward volume. Trading activity can accumulate without an equivalent increase in positions outstanding.
This explains the difference between volume and open interest. Volume measures contracts traded during a period; open interest measures contracts still outstanding. If both counterparties open positions, open interest rises. If both close, it falls. When one opens and the other closes, it stays unchanged. Each transaction still contributes to volume.
Rising open interest does not, by itself, identify a bullish market. Every new contract pairs a long position with a short position. Price behavior supplies the directional context that the contract count lacks.
High Compared With What?
An isolated volume figure has little meaning. A busy opening period may look good compared with a relatively quiet midday interval but would be fairly mundane compared with previous openings. The comparison should be between similar time intervals, using a common reference.
Before interpreting an apparent spike, check:
- Time window: Completed intervals of equal length should be compared, so, for intraday analysis, similar times of day, if possible.
- Recent activity: Choose several comparable sessions, rather than one particularly quiet day.
- Market coverage: Determine whether the feed covers one exchange, a consolidated market, or a particular futures contract month.
- Special events: News, index rebalancing, holidays, and contract rollover can change activity without supporting a simple directional conclusion.
For example, 30,000 contracts against an average of 10,000 represents a relative volume of three times the norm, and this would flag unusual activity. Explaining that activity still requires the event context and price response.
Read Volume Against Price Progress
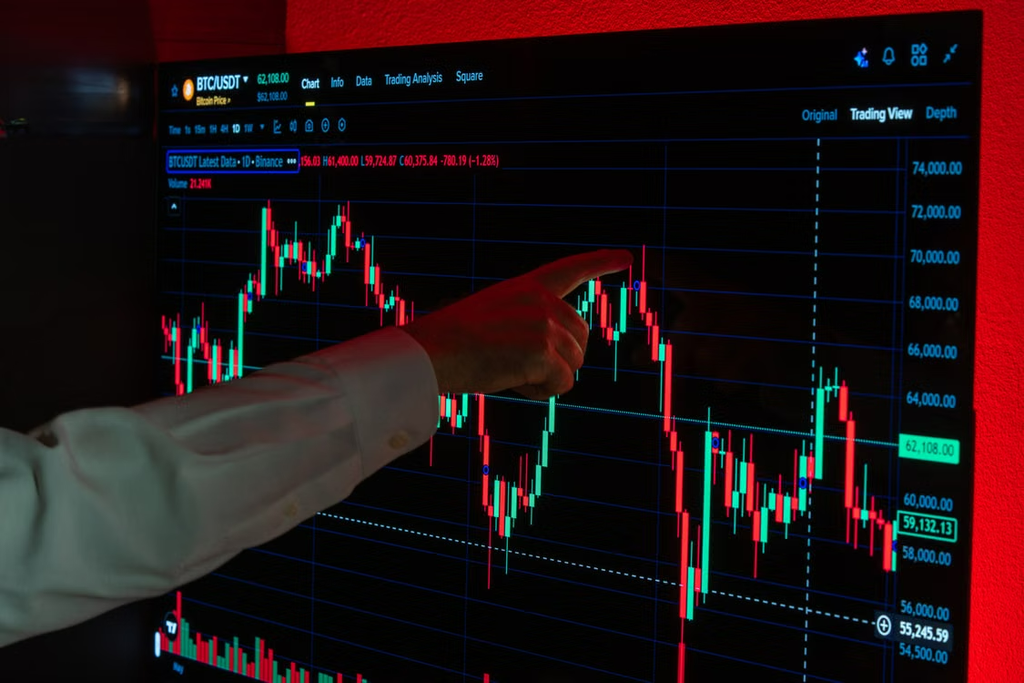
The same volume increase can accompany very different outcomes. Examine where the price finished, how far it traveled, and whether it stayed beyond an established support or resistance area.
Here are potential questions to investigate (they aren’t fixed trading instructions but example combinations):
| Observation | Possible interpretation | Follow-up question |
| Price advances as volume expands | Greater activity accompanies the advance | Does trading continue at higher prices? |
| Volume surges but price stalls | Opposing orders may be absorbing pressure | Which side becomes aggressive, and does the level hold? |
| Price moves sharply on low volume | Limited available liquidity may allow rapid movement | Does activity increase when the market revisits the area? |
| A pullback occurs on lighter volume | Participation in the counter-move may be weakening | Does the prior trend resume? |
Suppose a futures market breaks above yesterday’s high on heavy volume, then quickly returns below it. The volume proves that substantial trading occurred around the attempt. The return below the level weakens the case that participants will continue trading at higher prices. Calling the initial surge bullish would overlook the subsequent rejection.
Where the Trades Happened
A volume bar compresses the entire interval into one total. Whether most trades occurred near the high, near the low, or throughout the range remains hidden. That distribution can change how you interpret an otherwise ordinary candle.
Different volume analysis tools answer different questions. A volume profile groups traded volume by price based on a selected period. A footprint displays price-level activity within individual bars. Bid-and-ask views separate aggressive selling into resting buy orders from aggressive buying into resting sell orders.
Delta is ask volume minus bid volume. Positive delta means more volume came from aggressive buying, although passive sellers may still prevent the price from rising. This is why a large positive reading can coexist with little upward price movement. You can get context from execution behavior, but it doesn’t reveal every participant’s motive.
Busy Markets Can Still Be Difficult to Trade
Volume records trades that have already happened. Liquidity tells you how easily you could buy or sell now without moving the price substantially. Even after a busy session, the bid-ask spread may be wide, or too few contracts may be available near the quoted price. In fast markets, traders can cancel resting orders before your order arrives.
Check what your volume feed covers, too. Exchange-reported futures volume covers specific contracts; a crypto feed may show just one exchange. On some spot forex charts, tick volume counts price updates instead of traded units. Each measure has its uses, but check those definitions before treating two volume figures as comparable.
Turn the Observation Into a Testable Question
According to behavioral finance research, social proof and confirmation bias can impact your financial decisions easily. You can have the urge to join the move immediately when you notice heavy activity. If you already expect a rally, you may interpret any volume increase as support, even when the price stops advancing.
A short review process helps keep the interpretation specific:
- Write down the observation. Before you assign a cause, document the interval, volume, comparison baseline, and price response.
- Consider an alternative. Heavy buying might accompany a breakout, but it might also meet persistent selling near resistance.
- Define contradictory evidence. State what would weaken the idea, such as a return inside the previous range.
- Review both outcomes. Keep examples that failed alongside those that worked, including the costs any proposed trade would incur.
Trading volume provides you with an activity log, the relevance of which varies depending on the situation. Compare it to a pertinent baseline, find the transactions, then look at the price behavior that results. Before deciding, use those observations to test a specific hypothesis.